How to Read Topographic Maps
Topographic maps are complicated to say the least. They have a lot going on with different colors, lines, and labels all over the place. The land survey information is a good example. While most topo map users aren’t reading the township, range, and section information, it is still on the maps. Another example is that roads, trails, power lines, railroads, and property boundaries are all black lines on topo maps, and they only vary slightly. The legend for USGS topographic maps is complex with three full pages of symbols and color explanations.
The intricate details of topographic maps can be learned over time, but the first thing that people need to understand is how to read the topography. This focuses mainly on the brown lines. But learning what these lines mean is only half the battle. Gaining experience by comparing topo maps to actual topographies is the other half. Taking topo maps out into the real world is the best way to do this.
Reading the topography
After using topo maps outdoors you eventually can “see” the topography through the lines drawn on the page. Having shaded relief helps a great deal (TopoZone’s topo maps are shaded), but to get started understanding what the lines are conveying, there are a few simple things to learn.
- Brown lines on the maps are elevation contour lines, a.k.a. “contours.” Each contour continues at the same elevation across the page. Adjacent contours are going up or down in elevation (see numbers on the lines to determine which way they are going).
- Contours that are far apart show flat or gradually sloping land. These include flats, plains, meadows, and plateaus.
- Contours that are close together show steep land. The closest are sheer cliffs and as the lines space out the slope decreases.
- Bending contours show either a ridge or a valley. Valleys often have streams (blue lines running down them).
- Looping contours are surrounding a high point or summit. Summits have concentric elevation lines that get larger as they go down in elevation. Finding summits helps visualize the topography and distinguish ridges from valleys. Note that in the rare cases of depressions not filled with water, the contour lines will have tick marks pointing inward toward the bottom.
Here is a typical topographic map with many of these items identified by a number. See the explanation of each number below the map.

- Flat area – contours spaced out (a basin in this case)
- Steep area – contours tight together (cliffs in this case)
- Ridge – contours bent around the hill
- Valley – contours bent into the hill (with creek in this case)
- Pass – contours come together then diverge
- Summit – contours looping around a point (note elevation 5625 ft)
- Trail – dashed single black lines (note the trail number 1315)
- Road – double black lines (note the road number 115)
- Stream blue lines (note the name in blue text)
- Pond/Lake – blue area representing a body of water (note that this one is too small to have a name)
Reading the elevations
The next step in reading topographic maps is learning the elevations. Elevations are provided on some of the brown contour lines. Those are the darker lines, called index lines, which have round numbers (hundreds for example). To figure out the interval between lines find two labeled lines close together and count the faint brown lines between. Typically there are four faint lines which means five elevation changes between major lines. For example if one line says 4200 and the next labeled line says 4300 and there are 4 faint lines between, then the intervals are 20 feet (100 feet divided by 5 spaces between the lines). Note that most USGS topo maps are in feet but some are in meters. See the map below showing this example.
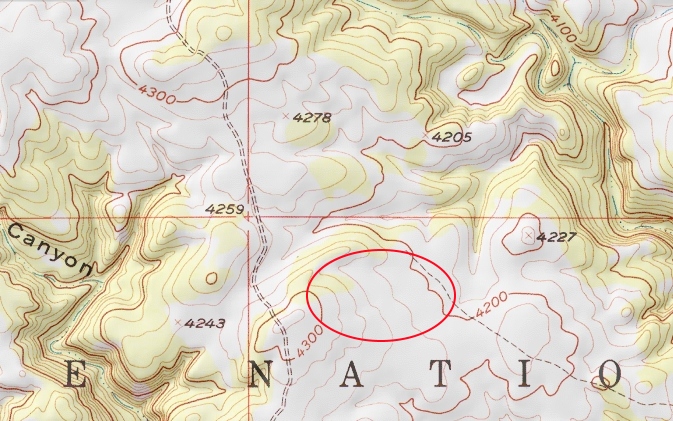 4300 – 4200 = 100 and 100 / 5 = 20, so each contour on this map is 20 feet
Scale of topographic maps
If you have a paper map, the scale is easy to understand. Typically the USGS maps have a scale at the bottom and you can use that measurement on the map to calculate the distance between two points. Using online maps like those on TopoZone is different, mainly because the maps can be zoomed in and out which makes the scale change. The scale we use is dynamic so it changes to be accurate at each zoom level. Just look in the bottom right corner of our maps for the scale.
Orientation of topographic maps
All the maps on TopoZone are oriented so true north is straight up on the page, but if you will be navigating using a compass, you’ll need to know how to find the magnetic north “declination.” Learn more about that with our page on orientating topographic maps.
Have fun and be safe out there!
– TopoZone